Use case: events and visitors

What did that event do for us, and where did our visitors come from? Capability preview

MIQ shows which markets send visitors to a place, compares activity around an event with a typical week, and estimates economic impact under assumptions you can change.

An illustration of a regional map with curved arrows from surrounding areas converging on one destination, nearer areas shaded darker.
IllustrativeIllustration. Where a place’s visitors can come from. Not product output; no data is shown.
Capability preview

Capability preview. Visitor and event analysis runs today in MIQ location intelligence in development and is not yet part of MIQ Studio. The pictures on this page are illustrations, not product output.

Where visitors come from

See which markets send visitors to your destination, district or venue: the ZIP codes and counties they come from, how far they travel and how that compares with the people who live nearby. The map says how much of the activity it can place and how much it cannot.

  • Origin ZIP codes and counties, ranked by share of modeled visits
  • Nearby residents compared with longer-distance visitors
  • How visitor markets differ between destinations
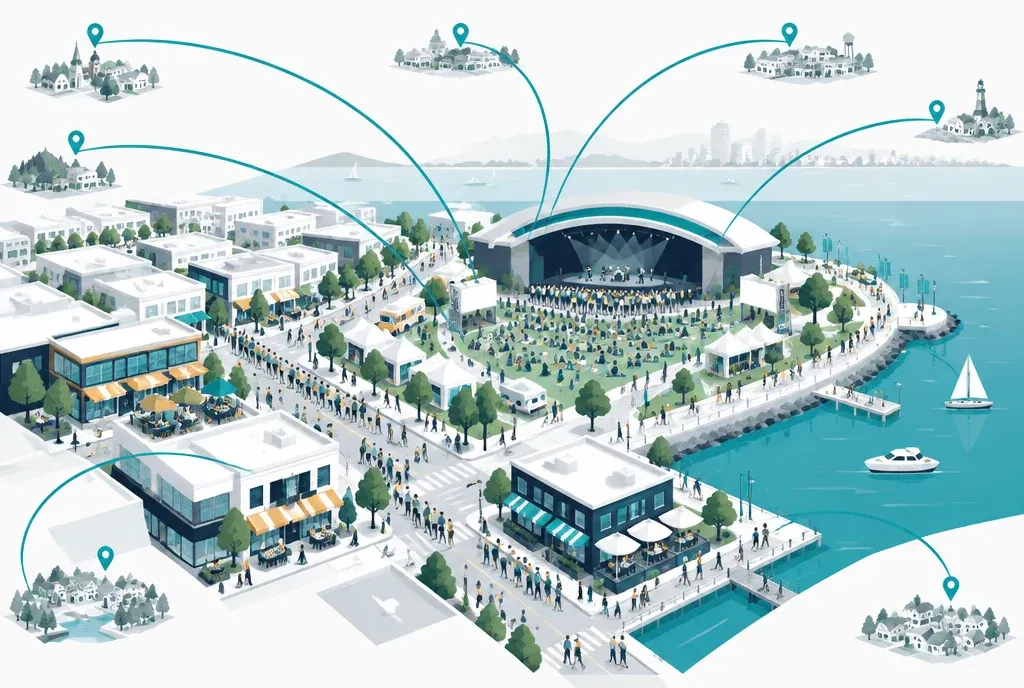
An illustration of a waterfront festival with crowds arriving and curved lines from surrounding towns converging on the venue.
IllustrativeIllustration. Visitors travel from surrounding places to one venue.

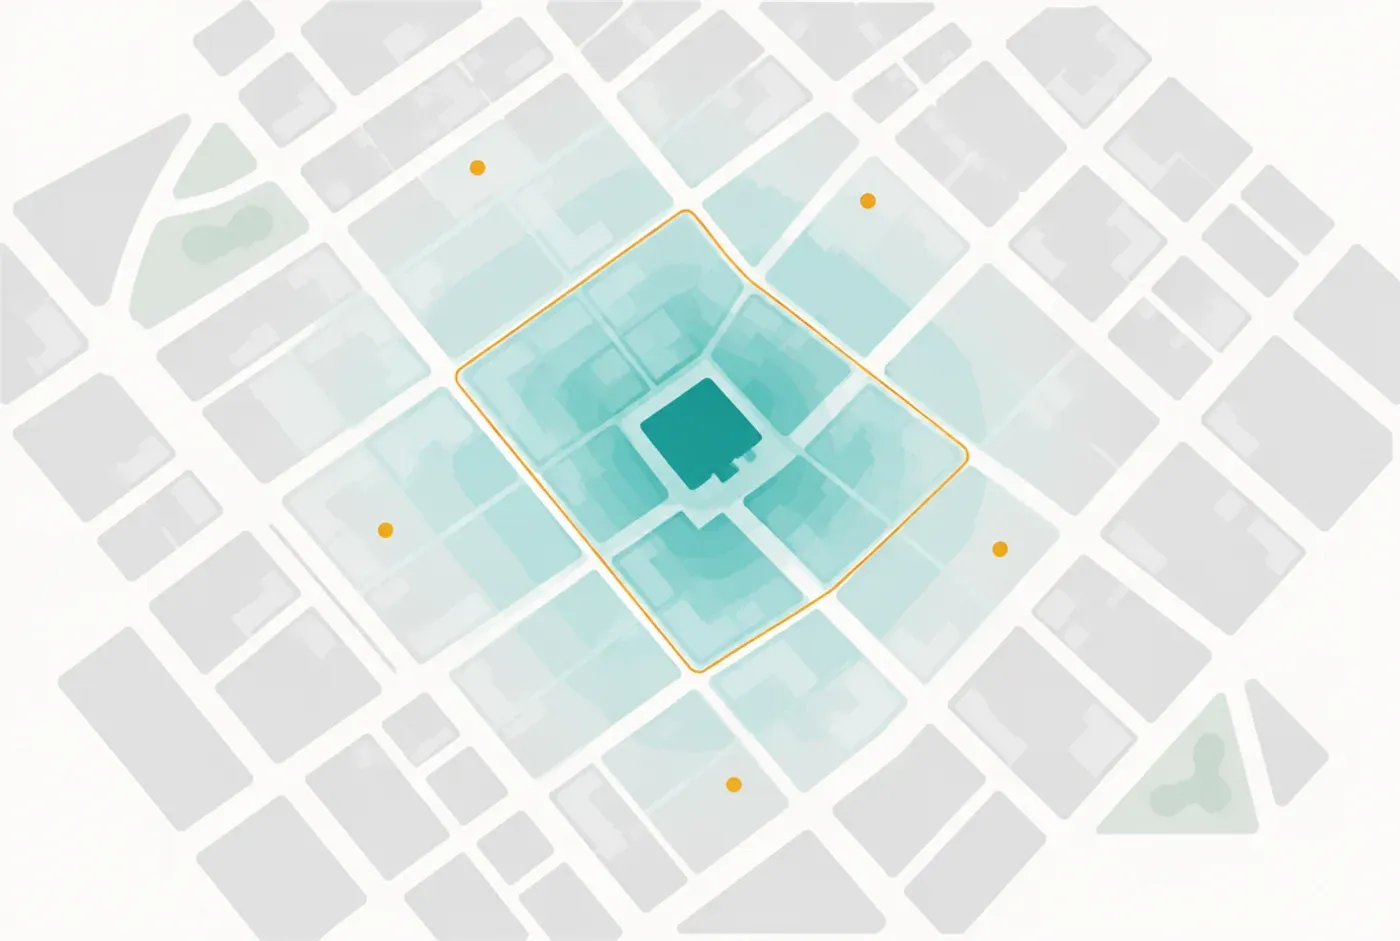
A destination and the streets around it

Put a venue on the map with the commercial areas around it and see where activity concentrates. The shading shows modeled visits for each neighborhood, so you can see which nearby streets share in a busy week.

  • Activity by neighborhood around the venue
  • The restaurants, shops and lodging nearby
  • Which surrounding areas see more of the activity
An illustration of a street grid with the blocks around one venue shaded from strong at the center to faint at the edges, inside an amber event-area outline.
IllustrativeIllustration. Activity around a venue, strongest nearby. Not product output; no data is shown.

How an event compares with a normal week

MIQ compares the weeks around an event with typical weeks for the same place. The comparison is relative: it shows whether activity was higher or lower than usual, and by how much, as a modeled estimate. It does not count attendance. If you know the attendance, you enter it, or MIQ uses a published figure, and it is shown separately and labeled as reported.

  • Event week compared with matched typical weeks
  • Comparison across events and venues
  • Reported attendance shown separately from modeled activity

What it may be worth

Enter attendance and your assumptions about visitors and spending. MIQ estimates the spending that is new to the local economy and its broader modeled effects, and lets you change each assumption to see what moves the result. It is a scenario under assumptions you set, not a measurement of what visitors actually spent.

  • Local and non-local visitors, with the share of spending that stays local
  • Spending by category, such as restaurants, lodging, retail and transportation
  • Scenarios side by side, with a range instead of a single number
An illustration of a waterfront festival with hotels, restaurants, shops and a parking structure around it and rings of activity spreading outward.
IllustrativeIllustration. An event and the local economy around it. Not product output.

Look back to plan the next one

Use the same analysis to look back at where activity concentrated around past events and when it peaked. Historical patterns can inform staffing, access and the services nearby. MIQ does not monitor crowds as they happen.

  • Past activity patterns around a venue by day and week
  • Surrounding areas that may see more demand
  • A planning view for event teams and local government

What this shows and what it does not

How the work comes together

Every MIQ analysis follows the same path, whatever the question.

  1. The question

    Start with your question

    Where do our visitors come from, and what did that event contribute?

  2. The evidence

    MIQ gathers the evidence

    Modeled visit activity, visitor origins, your attendance figure, spending assumptions and the local economy.

  3. The analysis

    It maps and models

    Origin maps, event-week comparisons and an economic impact scenario you can adjust.

  4. The interpretation

    It explains what it found

    Plain-language findings that separate what is modeled, what you reported and what is an assumption.

  5. The deliverable

    You get a report to use

    A report for sponsors, councils or boards, with the assumptions and sources shown.

Every use case works the same way.

Every figure carries its source and the period it covers. Where the evidence does not support a conclusion, MIQ says so. You review, verify and own the work before it is published.

How MIQ works

Bring us your version of this question.

We'll work through it with you.