Examples

See what the work looks like.

Four example outputs from MIQ Studio, annotated to show where each figure comes from and what MIQ says it cannot conclude.

Example 1: A board briefing

The question: Prepare a briefing for next month's board meeting on how our regional economy is doing.
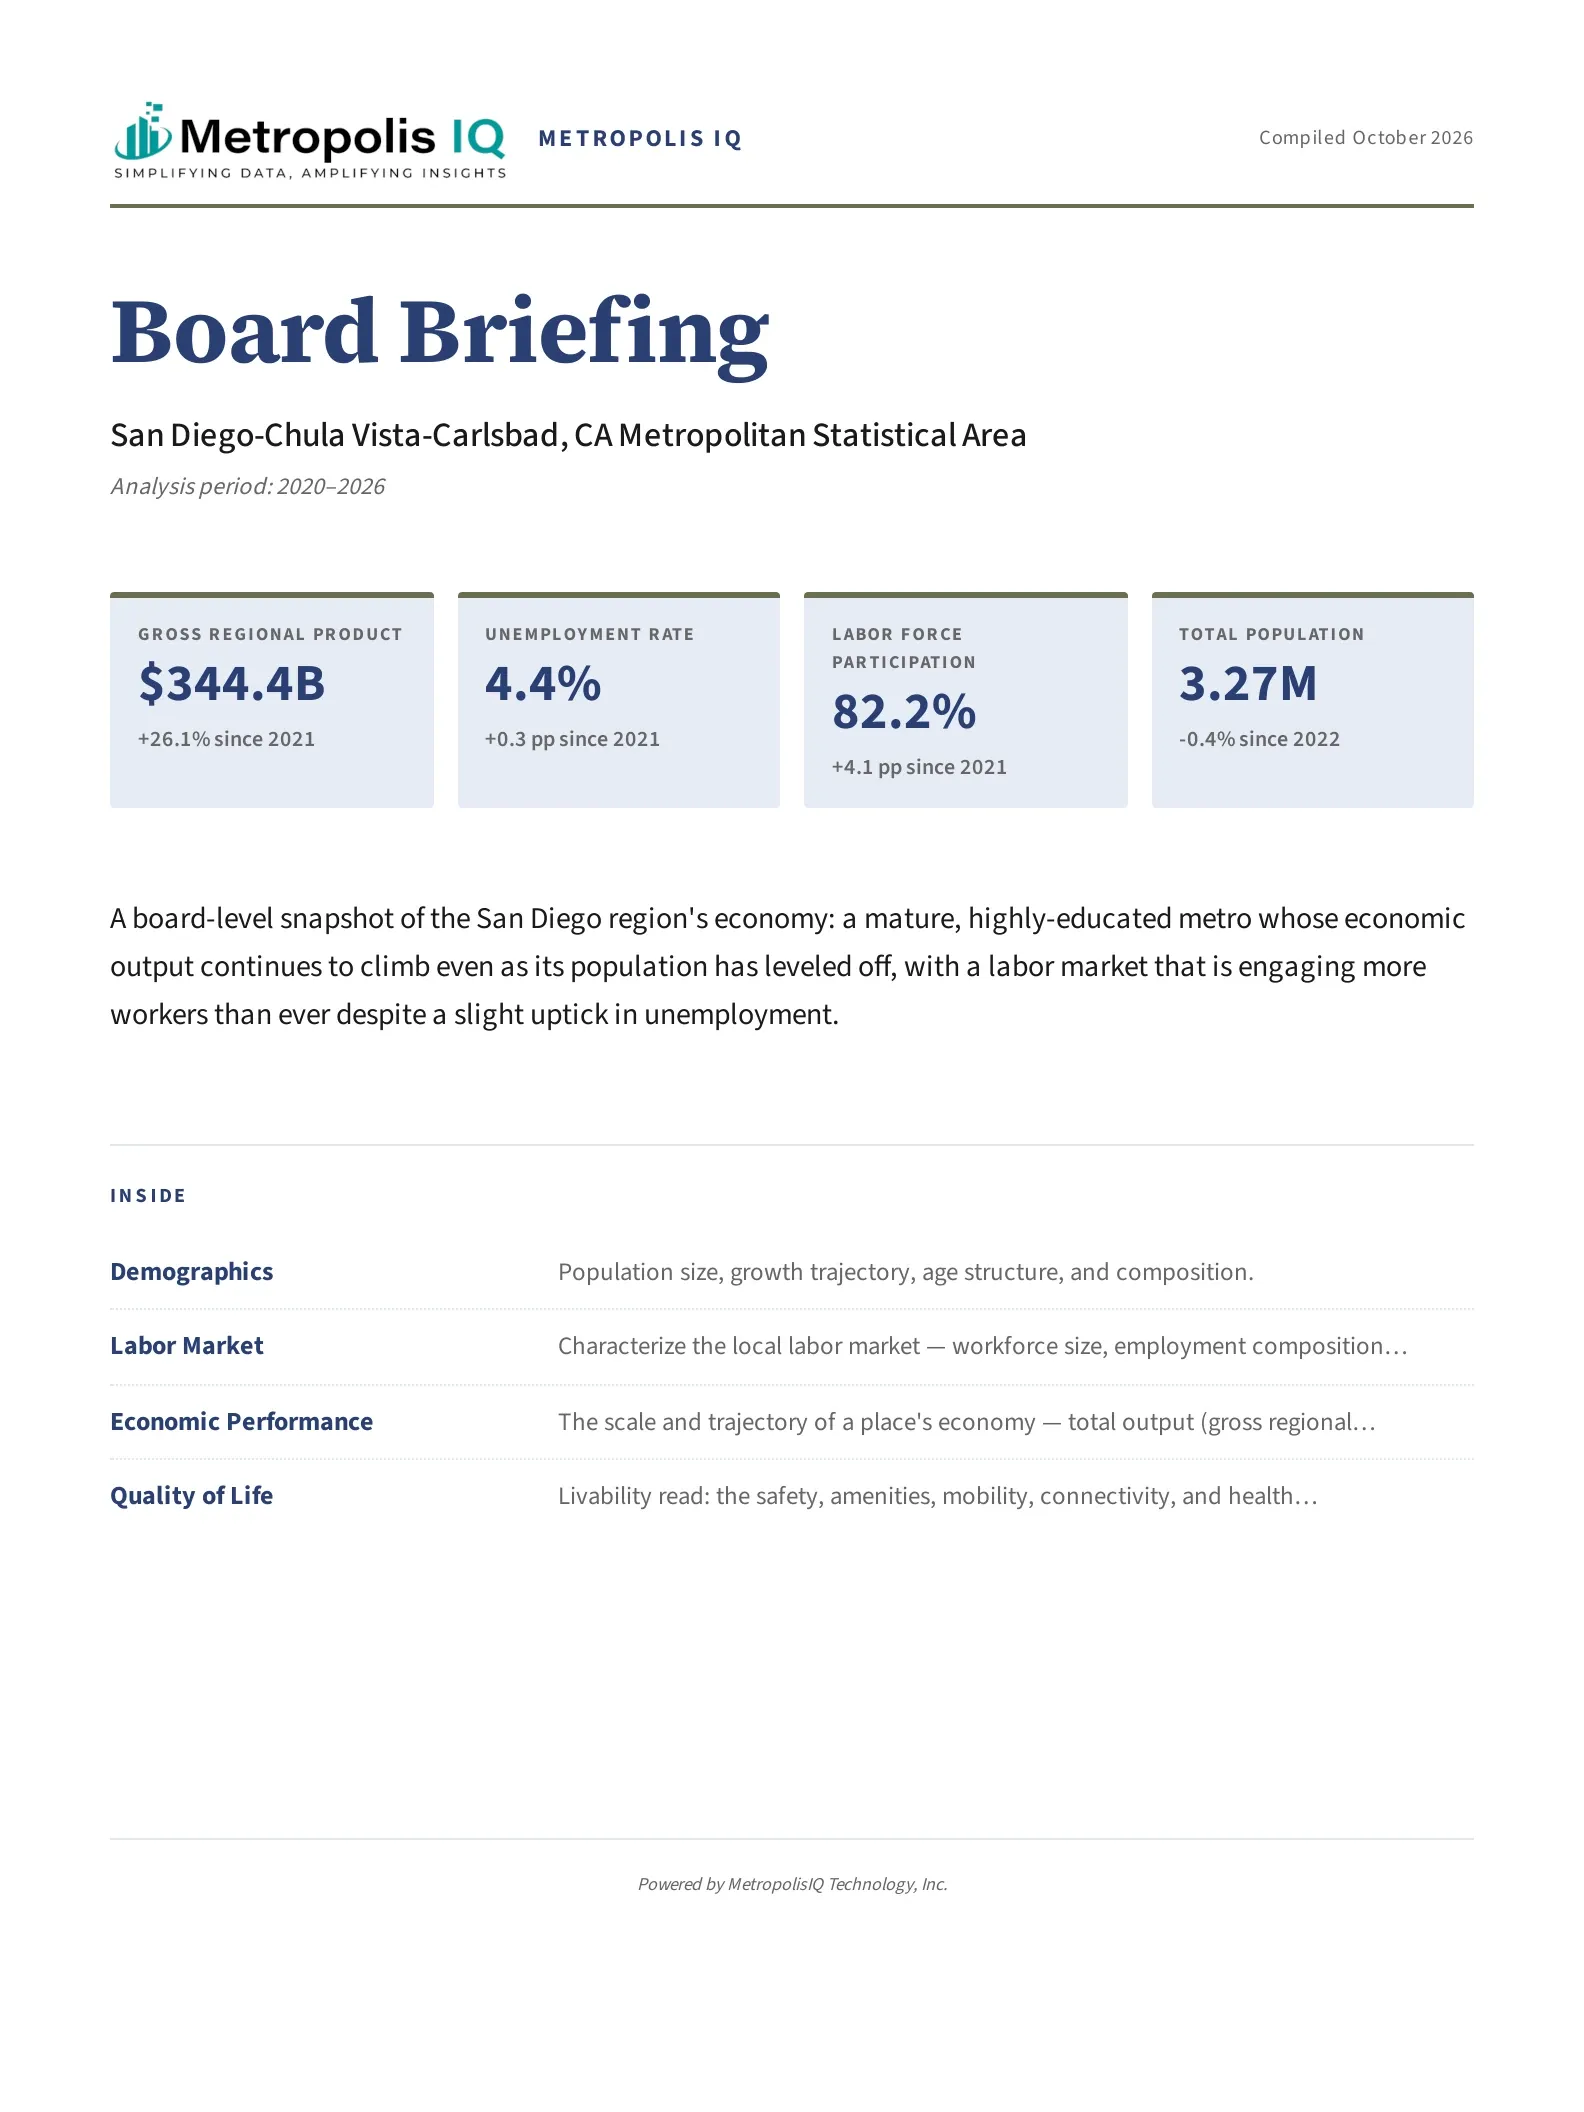
The first page of an exported MIQ Studio board briefing for the San Diego-Chula Vista-Carlsbad metro: four headline measures (gross regional product, unemployment rate, labor force participation, total population) and a contents list.
An exported MIQ Studio board briefing, first page.

What to notice

  1. The headline measures lead the report, each with how it has changed since the start of the period.
  2. A short plain-language summary sits under the measures, so a board member can read the picture in a minute.
  3. A contents list shows what the report covers: demographics, labor market, economic performance and quality of life.
  4. The report is branded from your Settings and is ready to export as PDF or Word.

Board and council briefings

What MIQ says it cannot conclude

Where data at the geography you asked for is not available, MIQ falls back to the next coarser level and says so in the methods note, so the report never presents a broader figure as if it were local.

Text version of this example
  1. Your question

    You ask for a board briefing on your region. MIQ builds it from the Board Briefing report type in Reports, using your home region unless you name another place, and shows the work as it goes.

  2. Headline measures

    The briefing opens with four headline measures for the region and how each has changed over the period. In this example, for the San Diego-Chula Vista-Carlsbad metro area: gross regional product of $344.4 billion (up 26.1 percent since 2021), an unemployment rate of 4.4 percent (up 0.3 points), labor force participation of 82.2 percent (up 4.1 points) and a population of 3.27 million (down 0.4 percent since 2022).

    Source: Bureau of Economic Analysis, Bureau of Labor Statistics and U.S. Census Bureau data.

    Period: analysis period 2020 to 2025.

  3. What the report covers

    Under the measures, a short summary describes the region's economy in plain language. The report then works through demographics, the labor market, economic performance and quality of life, with charts, and ends with a list of references, a methods note and a glossary.

  4. Board-ready output

    The finished report carries the name and logo you set in Settings, is saved in your Reports library, and can be downloaded as a PDF or a Word document, which your staff review before it is shared.
Example 2: A peer comparison

The question: Compare our manufacturing workforce with three competitor regions.

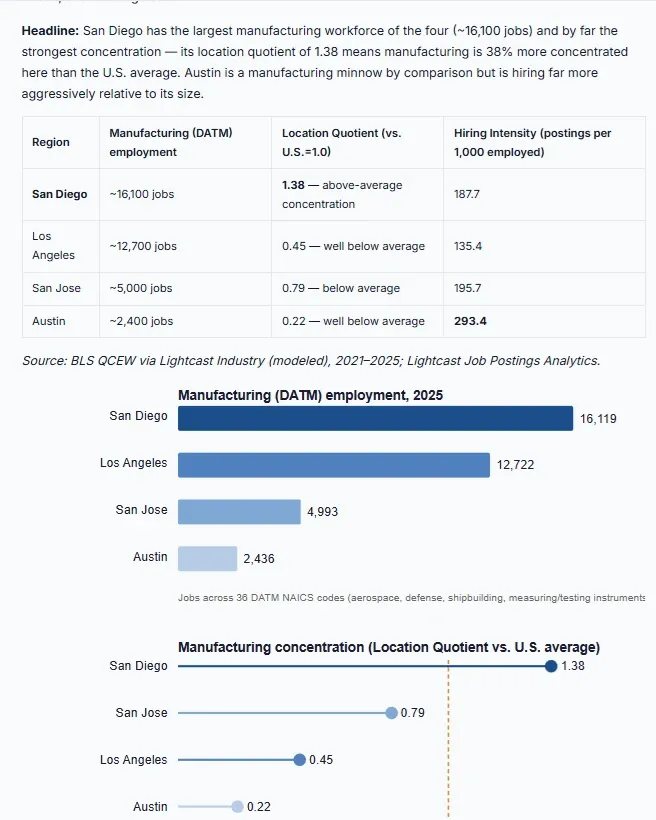
A MIQ Studio peer comparison of manufacturing employment for San Diego, Los Angeles, San Jose and Austin: a table of employment, location quotient and hiring intensity with source lines, a bar chart of employment and a chart of concentration.
A MIQ Studio screen comparing four regions.

What to notice

  1. The answer leads with the result in plain language: which region has the largest workforce and the strongest concentration.
  2. A table compares each region on employment, concentration compared with the U.S., and how hard employers are hiring.
  3. Every table and chart carries its source and the years it covers.
  4. A note says what each measure includes, such as the number of industry codes behind the manufacturing total.

Compare places

What MIQ says it cannot conclude

The employment figures are modeled estimates, and a manufacturing total depends on which industry codes are counted. MIQ says which codes it used, so you can check that the comparison covers the industries you care about before you rely on it.

Text version of this example
  1. Your question

    You ask how your manufacturing workforce compares with competing regions. MIQ confirms what you mean by manufacturing and which regions to compare with, and proposes peers if you have not named them.

  2. The comparison

    The answer opens with the result: in this example, San Diego has the largest defense, aerospace and related manufacturing workforce of the four regions (about 16,100 jobs) and by far the strongest concentration, a location quotient of 1.38, which means 38 percent more concentrated than the U.S. average. Austin has the smallest workforce but the most job postings relative to its size.

  3. Sources and years

    A table shows each region's employment, location quotient and hiring intensity (job postings per 1,000 employed). Charts then show 2025 employment (San Diego 16,119, Los Angeles 12,722, San Jose 4,993, Austin 2,436) and concentration against the U.S. average. Each carries its source line.

    Source: BLS Quarterly Census of Employment and Wages via Lightcast Industry (modeled); Lightcast Job Postings Analytics.

    Period: 2021 to 2025.

  4. What the measures include

    A note under the charts explains what is counted: here, jobs across 36 manufacturing industry codes covering aerospace, defense, shipbuilding and measuring and testing instruments.

Example 3: A workforce question

The question: Does our workforce support an advanced manufacturer opening a new plant here?

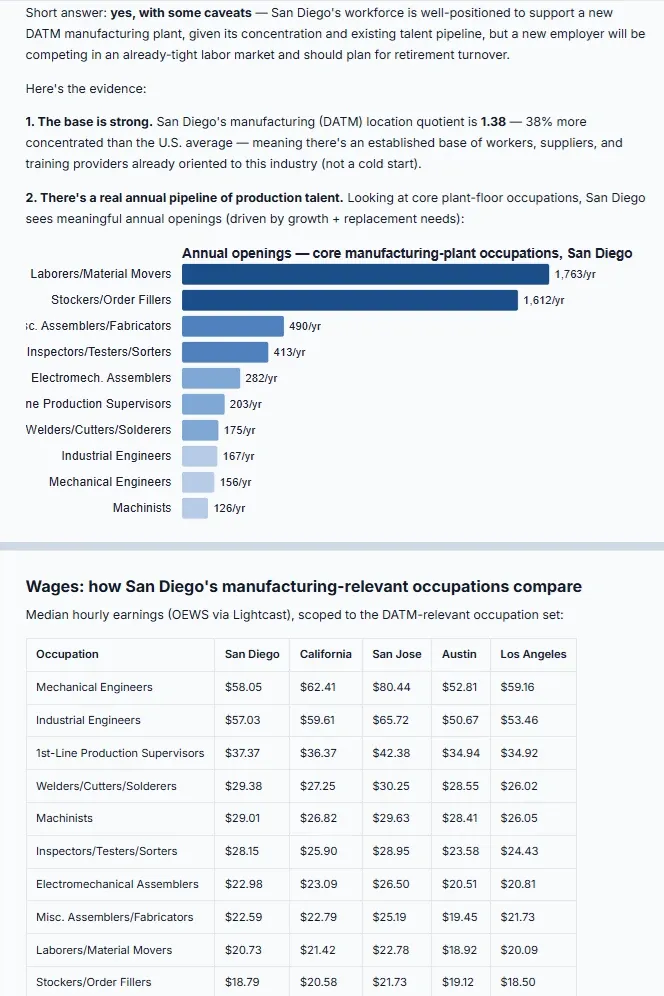
Two parts of one MIQ Studio answer about workforce for a manufacturer in San Diego: the evidence and a chart of annual openings by occupation, then a table and chart comparing median wages across five regions.
Two parts of one MIQ Studio answer.

What to notice

  1. The answer starts with a short answer and its caveats: yes, with some caveats.
  2. The evidence follows in numbered points: concentration of the industry locally, then the pipeline of annual openings.
  3. A chart shows annual openings by occupation, with the source named.
  4. A table compares median hourly wages for the same occupations across five regions.

Employer and prospect questions

What MIQ says it cannot conclude

Where a measure is not published for your city, MIQ says so and falls back to the state level, labeling the figure as directional. For example, projected program completions are available for California, not for San Diego alone, so the training-pipeline comparison is stated as a state-level view.

Text version of this example
  1. Your question

    You ask whether your workforce can support an advanced manufacturer opening a new plant. MIQ works with the occupations that plant would hire for and the region you named.

  2. The short answer

    MIQ opens with the answer and its caveats: yes, with some caveats. San Diego's manufacturing workforce is well positioned to support a new plant, given its concentration and existing talent pipeline, but a new employer would compete in an already tight labor market and should plan for retirement turnover.

  3. The evidence

    The base is strong: the location quotient for the manufacturing cluster is 1.38, 38 percent more concentrated than the U.S. average. There is also a real pipeline of production talent: a chart shows annual openings across core plant-floor occupations, led by laborers and material movers (about 1,760 a year) and stockers and order fillers (about 1,610 a year).

    Source: Lightcast Occupation projections, San Diego.

    Period: 2025.

  4. Wages across regions

    A table of median hourly earnings for the same occupations compares San Diego with California, San Jose, Austin and Los Angeles, and a chart singles out one occupation, welders, so you can see how pay compares.

    Source: BLS Occupational Employment and Wage Statistics via Lightcast Occupation.

    Period: 2025.

Example 4: An incentive review

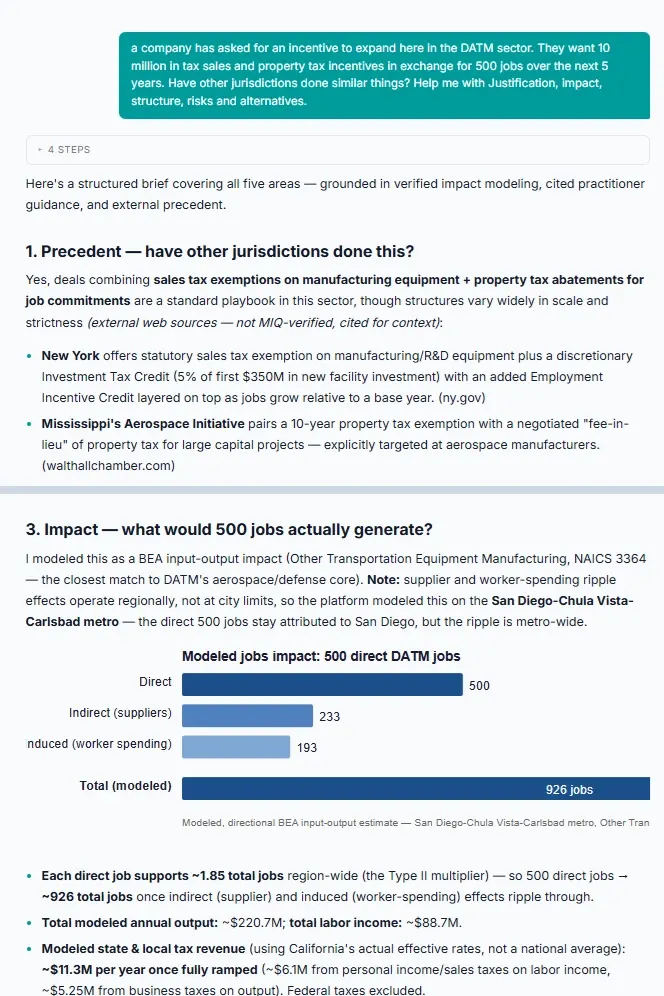
The question: A company has asked for $10 million in sales and property tax incentives in exchange for 500 jobs over the next five years. Have other jurisdictions done similar things? Help me with the justification, impact, structure, risks and alternatives.

Two parts of one MIQ Studio answer to an incentive request: the question with precedents from other jurisdictions, then the modeled impact of 500 jobs with a chart and the numbers behind it.
Two parts of one MIQ Studio answer.

What to notice

  1. The request is stated back and the answer is organized into the areas you asked about.
  2. What other places have done is shown with its source, and labeled as outside examples that MIQ has not verified.
  3. The impact is modeled and labeled as such: 500 direct jobs become about 926 total jobs, with the multiplier and the numbers behind it shown.
  4. The answer continues through justification, structure, risks and alternatives, covered in the text version.

Incentive review

What MIQ says it cannot conclude

The impact figures are modeled estimates, not measured outcomes, and the examples from other places are outside sources that MIQ has not verified. MIQ labels both, so you can decide how much weight to give each before the numbers go in front of a council.

Text version of this example
  1. Your question

    You describe the request: here, $10 million in sales and property tax incentives in exchange for 500 jobs over five years in a defense and aerospace manufacturing sector, and you ask whether others have done similar things and for help with justification, impact, structure, risks and alternatives.

  2. Precedent

    MIQ finds what other jurisdictions have done and lists them with their sources. It labels these as external web sources that MIQ has not verified, cited for context. In this example: New York, Mississippi and Connecticut offer tax exemptions or abatements for manufacturing, and an Oregon project is cited as an example of how much incentive-to-job ratios vary.

    Source: external web sources, not MIQ-verified.

  3. Impact

    MIQ models the impact of 500 direct jobs using an input-output model and says where the effects land: the ripple is measured for the metro area, while the direct jobs stay attributed to the city. In this example each direct job supports about 1.85 total jobs, so 500 direct jobs become about 926 total jobs, with a modeled annual output of about $220.7 million, labor income of about $88.7 million, and modeled state and local tax revenue of about $11.3 million a year once fully ramped.

    Source: Bureau of Economic Analysis regional input-output model, modeled estimate for the San Diego-Chula Vista metro.

  4. Justification, structure, risks and alternatives

    The answer then asks whether the data supports the request, and sets out how a deal could be structured to limit risk, what to watch for, and alternatives to the request as made.

Want to see yours?

Bring a real question. We'll work through it with you.