Use case: commercial districts

How is our downtown doing, and where are the opportunities? Capability preview

MIQ puts a district's business mix, its activity over time and the people who live and work around it in one analysis, beside a district you choose, with the sources and limits shown.

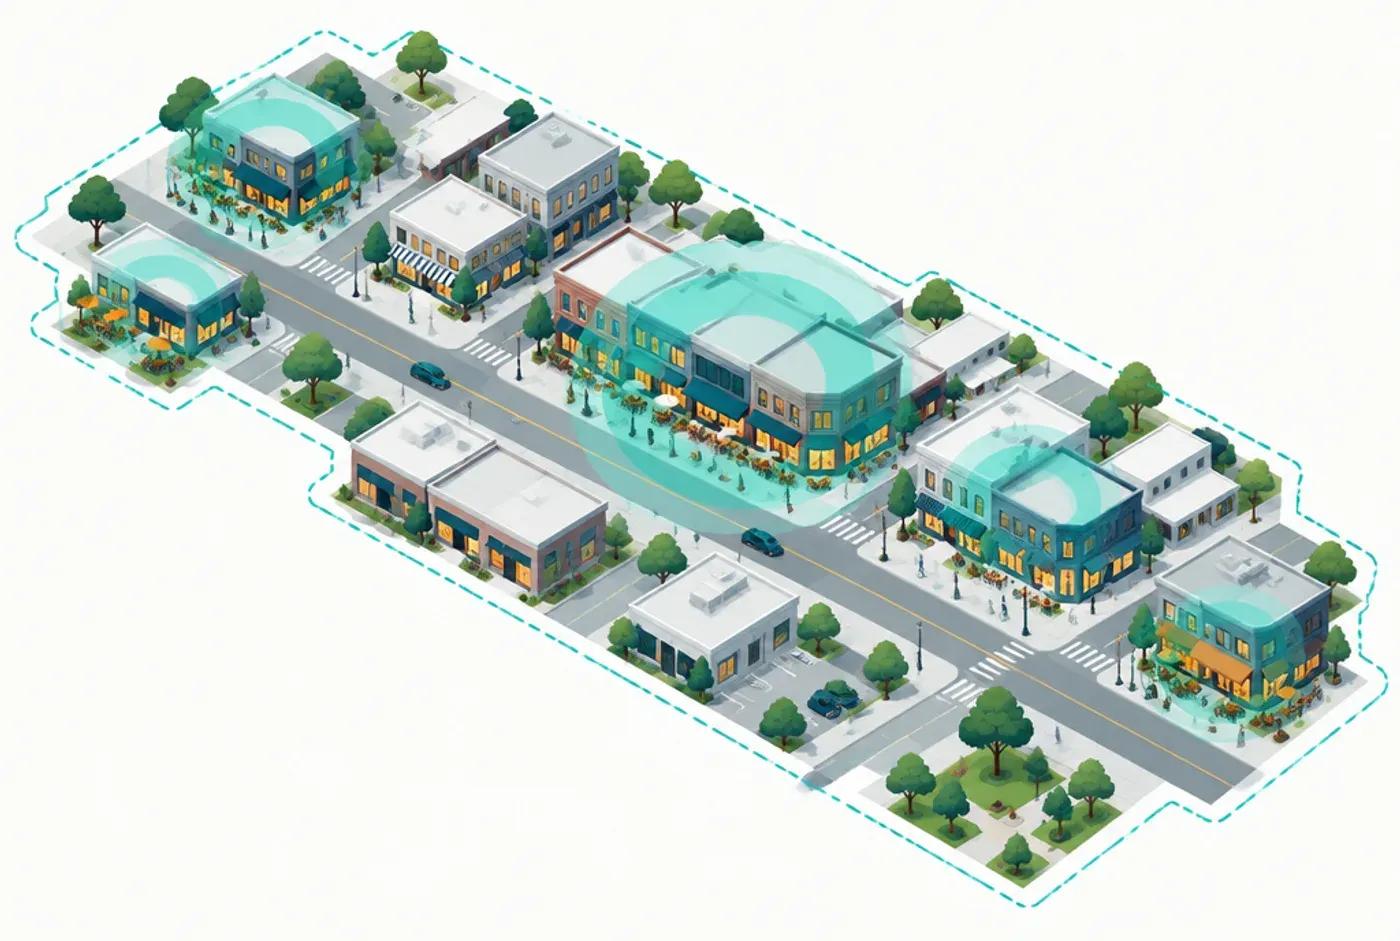
An illustration of a downtown main street with soft teal circles over clusters of shops and restaurants inside a dashed district boundary.
IllustrativeIllustration. A district and where its business activity can cluster. Not product output.
Capability preview

Capability preview. This analysis runs today in MIQ location intelligence in development and is not yet part of MIQ Studio. The pictures on this page are illustrations, not product output.

See the district the way a customer would

Choose your district and see what is in it: the businesses, grouped by what they do, and how they are spread across the streets. The inventory of businesses sits beside the economic and workforce data MIQ already brings to every question, so the district is never analyzed in isolation.

  • A map of the district with every business grouped by category
  • The mix of restaurants, retail, services and entertainment
  • The district set beside the city, the county and the places you compete with
An illustration of a downtown main street with soft teal circles over clusters of shops and restaurants inside a dashed district boundary.
IllustrativeIllustration. A district and where its business activity can cluster. Not product output.

Compare it with a district like yours

Choose a comparison district and see where yours is stronger and where it is not. Business mix is a count of what is there. Activity is a modeled estimate of visits, shown over time so you can see seasons and change, with the period and the source on every chart.

  • Business category mix, side by side
  • Modeled activity over time, including seasonal peaks
  • A plain-language note on what the comparison can and cannot support
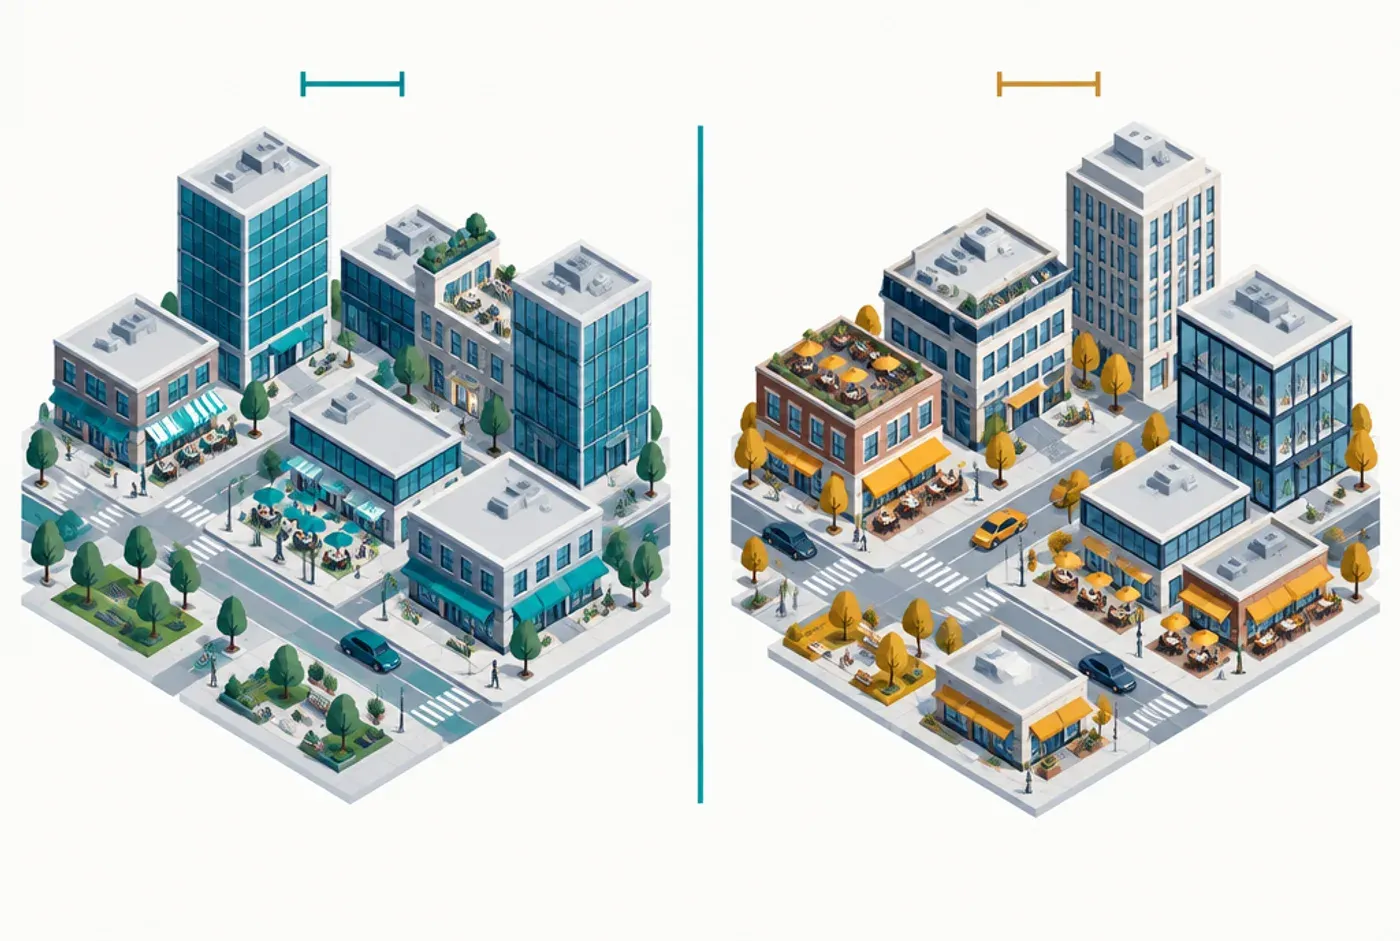
An illustration of two neighboring downtown districts side by side, each with a different mix of shops, restaurants and offices.
IllustrativeIllustration. Two districts, compared on the same measures. Not product output.

Where visitors come from

See which ZIP codes send visitors to a district, and how far they travel. The map is shaded by each ZIP code's share of modeled visits, and it says how much of the activity it can place and how much it cannot, so a thin map is never presented as a complete one.

  • Origin ZIP codes ranked by share of modeled visits
  • How far visitors travel to reach the district
  • Differences between nearby residents and long-distance visitors
An illustration of a regional map with curved arrows from surrounding areas converging on one destination, nearer areas shaded darker.
IllustrativeIllustration. Where a place’s visitors can come from. Not product output; no data is shown.

Who lives and works nearby

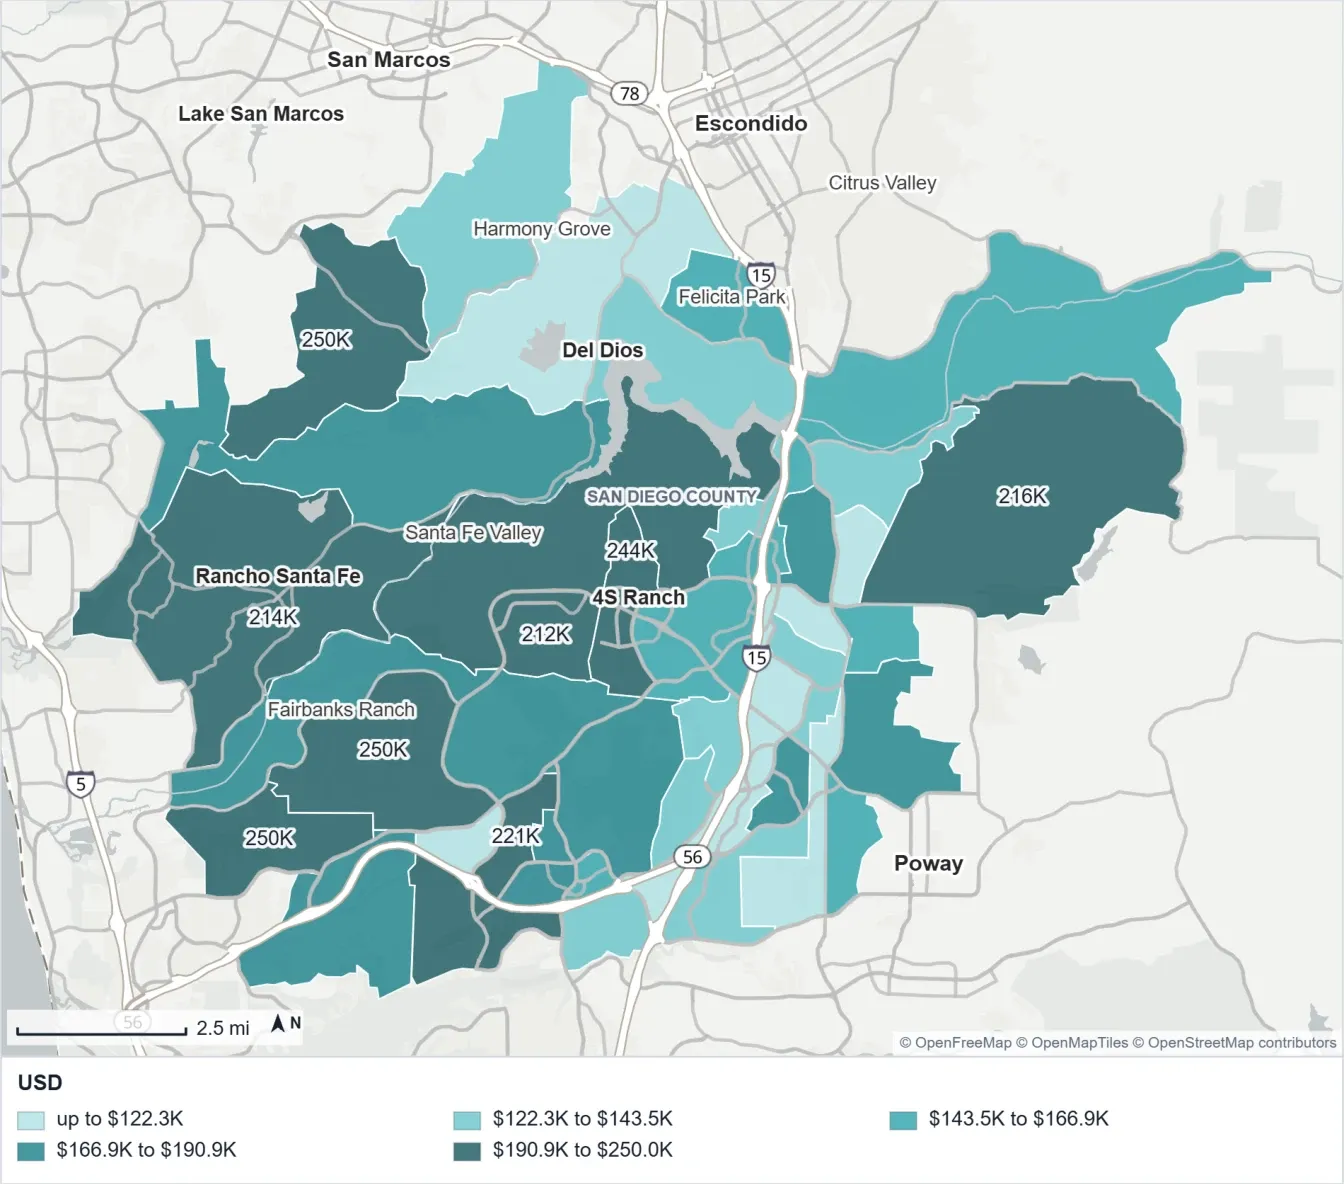
A district's market is the people around it. MIQ adds the demographics of surrounding neighborhoods and the jobs nearby, from official Census data, so you can see the households and workers a district can serve.

  • Household income and age of the surrounding neighborhoods
  • Where the district's workers live, from Census home-to-work data
  • Employment and industry context from the same analysis
A map of neighborhoods shaded by household income band, with place names and a legend in dollars.
Capability previewHousehold income of surrounding neighborhoods. Census-based map from a report in development.

Opportunities worth a conversation

MIQ points to business categories that look underrepresented for a district of this profile, and to nearby businesses that complement the ones already there. Each lead shows the evidence behind it. They are starting points for attraction and retention conversations, not proof of demand.

  • Categories that look thin compared with similar districts
  • Complementary businesses nearby, with the reason they were suggested
  • Retention conversations to start with the businesses already in the district

Take it to your board

MIQ writes the findings in plain language and builds the report: an executive summary, the maps and charts, the sources and what the evidence does not show. You review and edit it before it goes to your board, your members or a funder.

  • An executive summary written for people who did not see the analysis
  • Maps and charts with their sources and periods
  • Word or PDF, in your organization's name and colors
An illustration of a staff member reading a printed report with a map and charts at a desk.
IllustrativeIllustration. A report your team reviews and edits before it is shared. Not product output.

What this shows and what it does not

How the work comes together

Every MIQ analysis follows the same path, whatever the question.

  1. The question

    Start with your question

    How is our downtown doing compared with a similar district, and where should we look first?

  2. The evidence

    MIQ gathers the evidence

    Business inventory, modeled visit activity, neighborhood demographics, jobs and the wider economy.

  3. The analysis

    It maps and compares

    A district map, a comparison with a district you choose, origin markets and activity over time.

  4. The interpretation

    It explains what it found

    Plain-language findings with their evidence, and a clear note on what the data cannot show.

  5. The deliverable

    You get a report to use

    An executive summary, maps and charts in your organization's name, ready for your review.

Every use case works the same way.

Every figure carries its source and the period it covers. Where the evidence does not support a conclusion, MIQ says so. You review, verify and own the work before it is published.

How MIQ works

Bring us your version of this question.

We'll work through it with you.